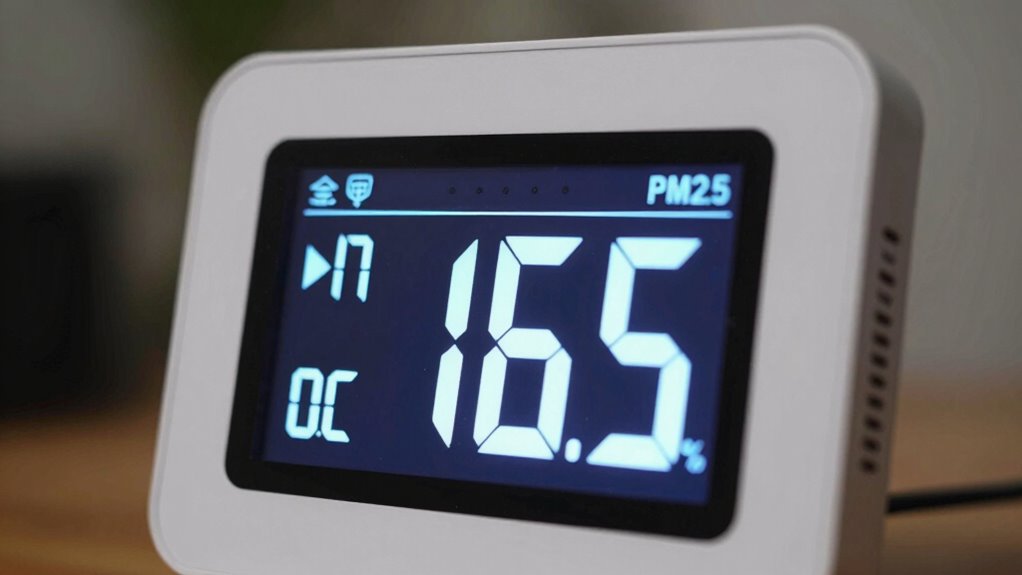

To understand a PM2.5 monitor, look at the micrograms per cubic meter (µg/m³) value—it shows how many tiny particles are in the air. Lower numbers mean cleaner air, while higher numbers indicate more pollution. Pay attention to color-coded categories: green or blue means safe, yellow to red signals increased health risks. Weather and location influence levels, so compare data with local updates. Keep exploring to get a clearer picture of what these numbers mean for your health.
Key Takeaways
- PM2.5 levels are measured in micrograms per cubic meter (µg/m³); lower numbers indicate cleaner air.
- Use color-coded air quality categories (green, yellow, orange, red) to interpret pollution severity.
- Readings below 12 µg/m³ generally signify safe air quality; higher values indicate increased health risks.
- Monitor variations based on location, weather, and proximity to pollution sources for accurate assessment.
- Regularly compare data with official air quality indices to determine whether outdoor activities are safe.
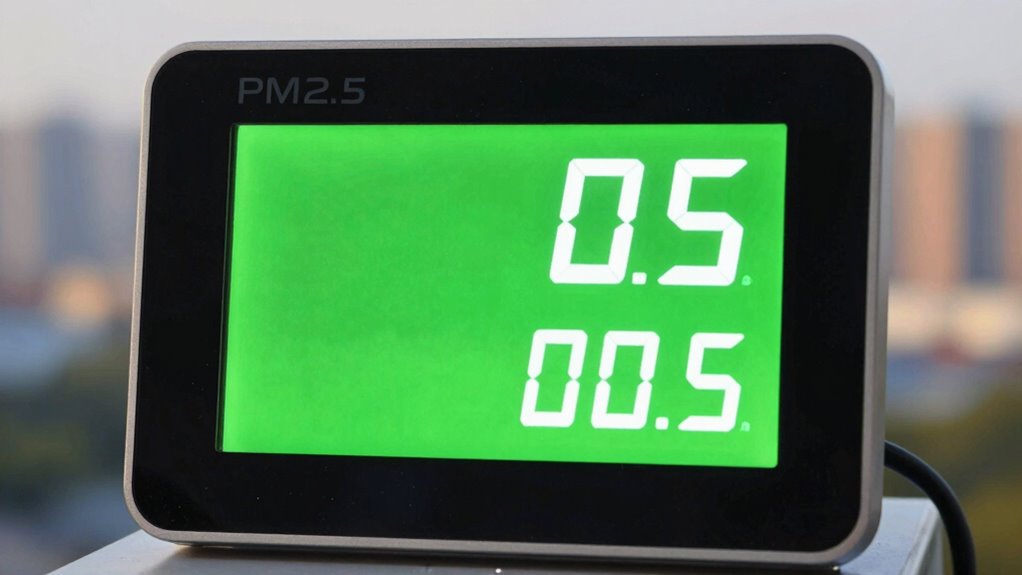
Monitoring PM2.5 levels is essential for understanding air quality and protecting your health. When you check a PM2.5 monitor, you’re getting a snapshot of the tiny particles in the air that can harm your lungs and overall well-being. These monitors typically display readings based on air quality indices, which translate the raw data into understandable categories like good, moderate, or unhealthy. Recognizing these categories helps you make informed decisions about outdoor activities, especially if you or loved ones are sensitive to air pollution.
Monitoring PM2.5 levels helps protect your health by revealing air quality and guiding outdoor activity decisions.
To interpret a PM2.5 monitor reading accurately, you need to understand what the numbers represent. PM2.5 measurements are usually given in micrograms per cubic meter (µg/m³). For example, a reading of 12 µg/m³ indicates the concentration of particles in a specific volume of air. The lower the number, the cleaner the air. However, these raw numbers are often converted into air quality indices, which simplify the information into color-coded categories. A green or blue color might mean the air is safe, while yellow, orange, or red signals increasing levels of pollution that could pose health risks.
Monitoring locations are vital because air quality varies greatly depending on where you are. Urban areas with high traffic or industrial activity tend to have higher PM2.5 levels than rural or suburban locations. When you read a PM2.5 monitor, consider where it’s placed. Monitors located near busy roads or factories often show higher readings, so it’s wise to compare these results with your local air quality index updates. Many cities have official monitoring stations that provide real-time data online, helping you track pollution trends over time. Understanding air quality standards can help you better interpret whether the levels you see are truly safe or hazardous.
It’s also important to understand that air quality indices are designed to give you a quick assessment. For instance, if your monitor displays a PM2.5 level in the “unhealthy” range, it’s time to limit outdoor exertion and consider staying indoors. Conversely, if the air quality is “good,” you can go about your day without concern. Keep in mind that weather conditions—like wind, rain, or humidity—can influence readings, so checking multiple monitoring locations or updated forecasts can give you a more complete picture. Becoming familiar with air quality standards can further help you interpret what levels are considered safe or hazardous.
As an affiliate, we earn on qualifying purchases.
Frequently Asked Questions
How Often Should I Calibrate My PM2.5 Monitor?
You should calibrate your PM2.5 monitor at least once every six months to maintain sensor accuracy. Calibration frequency depends on usage and environmental conditions; if you notice inconsistent readings, calibrate more often. Regular calibration guarantees your device provides reliable data, helping you track air quality effectively. Keep an eye on manufacturer recommendations, and consider professional calibration if precise measurements are vital for your health or research.
What Causes Sudden Spikes in PM2.5 Readings?
Imagine you’re near a busy road, and suddenly your pm2.5 monitor spikes—this happens because of air pollution sources like vehicle emissions. These sudden increases are often caused by temporary events, such as traffic congestion or construction, which overwhelm sensor sensitivity. These spikes reflect real changes in air quality, alerting you to nearby pollution sources. Keep in mind, quick fluctuations can also result from sensor sensitivity limits, so interpret readings carefully.
Can PM2.5 Levels Vary Indoors and Outdoors?
Yes, pm2.5 levels can vary indoors and outdoors. Indoor air quality often depends on factors like ventilation, indoor activities, and indoor pollution sources, which can cause higher or lower readings. Outdoor pollution, influenced by traffic, industrial emissions, and weather, also affects pm2.5 levels. You should monitor both to get a complete picture of your air quality, especially since outdoor pollution can seep indoors and impact your health.
What Health Risks Are Associated With High PM2.5 Levels?
High PM2.5 levels pose serious health risks, increasing your chances of respiratory issues, heart disease, and asthma attacks. When air quality standards are exceeded, you’re more vulnerable to pollution sources like vehicle emissions, industrial processes, or indoor cooking. To protect yourself, monitor your environment regularly, reduce exposure during high pollution times, and advocate for cleaner air policies to minimize these health threats.
Are There Different Types of PM2.5 Monitors?
Imagine peering into a tiny window of monitor technology, revealing different types of PM2.5 monitors. You find that some use laser scattering sensors, providing quick, real-time data, while others rely on filter-based methods, offering more detailed analysis but with delays. Sensor accuracy varies among these types, so you choose a monitor tailored to your needs—whether quick snapshots or in-depth insights, ensuring you stay informed about air quality.
Conclusion
Think of your PM2.5 monitor as a trusted lighthouse, guiding you safely through foggy, polluted waters. When the readings rise, it’s a warning signal, beckoning you to steer clear of danger. By paying attention to these numbers, you’re steering your environment with confidence and care. Just like a lighthouse keeps ships safe, your monitor keeps you informed—so you can make smarter choices and breathe easier in the storm.